
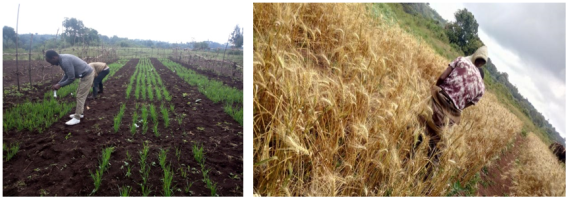
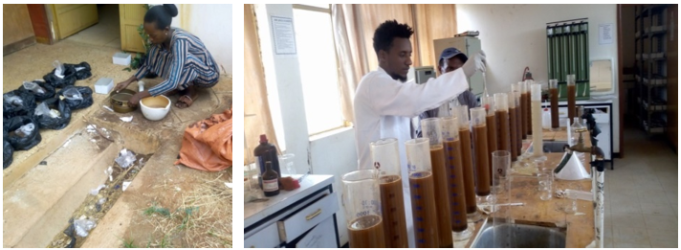
Bread wheat (Triticum aestivum L.) is one of the major food crops cultivated in West Guji and plays a significant role in ensuring food security in Ethiopia. However, low soil fertility and inadequate fertilizer application are among the major constraints limiting wheat productivity in the study area. The study took place in the West Guji southern Oromia, during the main cropping season in 2023. The study was aimed to determine the combined application of NPS and urea (N) fertilizer rates for bread wheat (Triticum aestivum L.) production. The treatments were (0 NPS) negative control, 60 kg NPS, 120 kg NPS, and 180 kg NPS, and (0 N) negative control, 140 kg N, 280 kg N, and positive control (100/100 kg ha⁻1 NPS/N). The treatments were arranged in a randomized complete block design and replicated three times. The results of the analysis of variance for agronomic characters indicated that the effects of fertilizer application rates were significant for the date of 50% heading, the date of 90% physiological maturity, plant height, the number of total tillers per plant, spike length per plant, effective tiller per plant, spikelet per spike, the number of grains per spike, thousand seed weight, and harvest index. The maximum duration of 50% days to heading (83.67 days) and day to 90% physiological maturity (136 days) was obtained from unfertilized plants, whereas the minimum duration of 50% day to heading (70.33 days) and day to 90% physiological maturity (120 days) was obtained from 180 kg NPS ha⁻1 + 280 kg N ha⁻1 fertilizer rates, respectively. The maximum plant height (92.5 cm) was also recorded under the highest fertilizer treatment, indicating a strong correlation between nutrient application and plant growth. These findings suggest that balanced fertilizer rates can significantly enhance both yield components and overall plant development. 21 cm), effective tiller per plant (5.21), number of total tillers per plant (5.25), spike length (9.21 cm), and 180 kg NPS ha⁻1 + 280 kg N ha⁻1 fertilizer rates, respectively. The maximum spikelet per spike (19) and number of grains per spike (74.67) were obtained from 120 kg NPS ha⁻1 + 140 kg N ha⁻1 fertilizer rates, respectively. The maximum thousand grains weight (38.00 gm) and harvest index (44.33%) were obtained from 180 kg NPS ha⁻1 + 140 kg N ha⁻1 fertilizer rates, respectively. Therefore, 180 kg/280 kg and 180 kg/140 kg ha⁻1 NPS/urea (N) are better, but 120/140 kg is best for gain yield, and the farming community can be used in the study area. This suggests that optimizing fertilizer application can significantly enhance bread wheat yield and yield components. Future research should focus on refining these rates further to maximize efficiency and sustainability in agricultural practices.
| Published in | Science Journal of Chemistry (Volume 14, Issue 4) |
| DOI | 10.11648/j.sjc.20261404.12 |
| Page(s) | 130-141 |
| Creative Commons |
This is an Open Access article, distributed under the terms of the Creative Commons Attribution 4.0 International License (http://creativecommons.org/licenses/by/4.0/), which permits unrestricted use, distribution and reproduction in any medium or format, provided the original work is properly cited. |
| Copyright |
Copyright © The Author(s), 2026. Published by Science Publishing Group |
Bread Wheat, West Guji, Fertilizer Rate, Ethiopia
No Trt | Fertiliozer treatements | Nutrient contents | ||
|---|---|---|---|---|
N | P2O5 | S | ||
1 | Control (negative) | 0 | 0 | 0 |
2 | 140kg (N) | 64.4 | 0 | 0 |
3 | 280kg (N) | 128.8 | 0 | 0 |
4 | 60 kgNPS | 10.8 | 22.8 | 4.2 |
5 | 60 kgNPS + 140kg (N) | 75.2 | 22.8 | 4.2 |
6 | 60 kgNPS + 280kg (N) | 139.6 | 22.8 | 4.2 |
7 | 120kg NPS | 21.6 | 45.6 | 8.4 |
8 | 120kg NPS + 140kg (N) | 86 | 45.6 | 8.4 |
9 | 120kg NPS + 280kg (N) | 150.4 | 45.6 | 8.4 |
10 | 180kg NPS | 32.4 | 68.4 | 12.6 |
11 | 180kg NPS + 140kg (N) | 96.8 | 68.4 | 12.6 |
12 | 180kg NPS + 280kg (N) | 161.2 | 68.4 | 12.6 |
13 | 100kgNPS+100kg (N) control (positive) | 64 | 38 | 7 |
Properties | Values | Ratings | ||
|---|---|---|---|---|
Before | After | Before | After | |
Clay (%) | 14.6 | |||
Silt (%) | 12.7 | |||
Sand (%) | 72.7 | |||
Textural class | Sandy loam | |||
pH: (H2O) 1:2:5 | 5.8 | 6.16 | Moderately acid | Slightly acid |
Organic Carbon (%) | 1.91 | 1.73 | low | low |
Total nitrogen (%) | 0.16 | 0.17 | medium | medium |
Available phosphorus (mg/kg soil) | 7.8 | 45.63 | low | Very high |
Available Sulfar (mg/kg soil) | 0.036 | 0.042 | Very low | Very low |
Cathane Exchange Capacity (CEC meq/100g) | 5.6 | 23.52 | Very low | medium |
No trt. | Fertilizer treatments | DH 50% | DPM 90% |
|---|---|---|---|
1 | Control (negative) | 83.67a | 136.0a |
2 | 140kg UREA (N) | 79.33ab | 128.0bc |
3 | 280kg UREA (N) | 73.67cde | 121.67de |
4 | 60 kgNPS | 76.00bcd | 128.67b |
5 | 60 kgNPS + 140kg UREA (N) | 75.667bcd | 124.33cd |
6 | 60 kgNPS + 280kg UREA (N) | 76.67bcd | 122.67de |
7 | 120kg NPS | 78.0bc | 127.67bc |
8 | 120kg NPS + 140kg UREA (N) | 75.33bcd | 121.00de |
9 | 120kg NPS + 280kg UREA (N) | 73.67cde | 120.00e |
10 | 180kg NPS | 70.333e | 123.33de |
11 | 180kg NPS + 140kg UREA (N) | 73.00de | 121.33de |
12 | 180kg NPS + 280kg UREA (N) | 70.33e | 120.00e |
13 | 100kgNPS+100kgUREA (N) control (positive) | 75.67bcd | 125.00bcd |
Means | 75.49 | 124.58 | |
CV% | 3.47 | 2.03 | |
LSD (0.05) | 4.45 | 4.26 | |
No. trt. | Fertilizer treatments | PH (cm) | NTP (no) | SLP (cm) |
|---|---|---|---|---|
1 | Control (negative) | 76.46g | 1.83k | 5.58i |
2 | 140kg UREA (N) | 83.88f | 3.21j | 7.13g |
3 | 280kg UREA (N) | 86.50cdef | 3.75g | 7.50f |
4 | 60 kgNPS | 84.08ef | 3.13j | 6.58h |
5 | 60 kgNPS + 140kg UREA (N) | 87.63cd | 4.0f | 7.71e |
6 | 60 kgNPS + 280kg UREA (N) | 90.75ab | 4.25e | 8.13d |
7 | 120kg NPS | 86.88cde | 3.38i | 7.88 e |
8 | 120kg NPS + 140kg UREA (N) | 89.38abc | 5.0b | 8.50c |
9 | 120kg NPS + 280kg UREA (N) | 88.58bcd | 4.71c | 8.88b |
10 | 180kg NPS | 86.04def | 3.63h | 8.08d |
11 | 180kg NPS + 140kg UREA (N) | 88.71bcd | 5.08b | 9.08a |
12 | 180kg NPS + 280kg UREA (N) | 92.21a | 5.25a | 9.21a |
13 | 100kgNPS+100kgUREA (N) control (positive) | 88.21bcd | 4.38d | 8.38 c |
Means | 86.87 | 3.96 | 7.89 | |
Cv% | 2.03 | 2.12 | 1.6 | |
LSD (0.05) | 2.97 | 0.14 | 0.21 | |
No trt. | Fertilizer treatments | ETP | SPS | NGP | TSW | HI (%) |
|---|---|---|---|---|---|---|
1 | Control (negative) | 1.63i | 14.04f | 49.58g | 29.0f | 25.42e |
2 | 140kg UREA (N) | 3.04h | 15.75e | 60.54f | 34.0abcde | 25.27e |
3 | 280kg UREA (N) | 3.63f | 16.92cd | 64.83e | 31.0def | 28.15cde |
4 | 60 kgNPS | 3.0h | 16.04e | 66.42de | 30.8ef | 29.07cde |
5 | 60 kgNPS + 140kg UREA (N) | 3.88e | 16.79d | 69.46c | 32.5bcdef | 25.07e |
6 | 60 kgNPS + 280kg UREA (N) | 4.13d | 17.58bc | 69.3c | 31.0def | 26.05de |
7 | 120kg NPS | 3.25g | 17.29bcd | 66.0de | 35.92ab | 28.43cde |
8 | 120kg NPS + 140kg UREA (N) | 4.88b | 19.000 | 74.67a | 33.67bcde | 38.18b |
9 | 120kg NPS + 280kg UREA (N) | 4.63c | 18.46a | 71.38b | 35.0abcd | 38.62ab |
10 | 180kg NPS | 3.50f | 17.38bcd | 67.0d | 31.75cdef | 32.08c |
11 | 180kg NPS + 140kg UREA (N) | 5.0b | 18.92a | 74.08a | 38.0a | 44.36a |
12 | 180kg NPS + 280kg UREA (N) | 5.21a | 18.96a | 74.46a | 35.2abc | 39.75ab |
13 | 100kgNPS+100kgUREA (N) control (positive) | 4.25d | 17.71b | 69.71bc | 32.0bcdef | 31.68cd |
Means | 3.84 | 17.26 | 67.49 | 33.0 | 31.7 | |
CV% | 2.64 | 2.29 | 1.62 | 7.14 | 11.45 | |
LSD (0.05) | 0.17 | 0.72 | 1.84 | 5.81 | 6.12 | |
AGB | Above-Ground Biomass |
CEC | Cathane Exchange Capacity |
CV | Coefficient of Variation |
GLM | Generalized Linear Model |
JARC | Jimma Agricultural Research Center |
LSD | Level of Significance |
NB | Net Benefit |
NPS | Nitrogen Phosphorus Sulfar |
OC | Organic Carbon |
OM | Organic Matter |
YPDARC | Yabello Pastoral and Dry Land Agriculture Research Center |
| [1] | Abera, D., Tana, T., & Dessalegn, T. (2020). Effects of blended NPSB fertilizer rates on yield and grain quality of durum wheat (Triticum turgidum L.) varieties in Minijar Shenkora District, Central Ethiopia. Ethiopian Journal of Agricultural Sciences, 30(3), 57-76. |
| [2] | Abera, T., & Adinew, A. (2020). Effect of blended NPS fertilizer supplemented with nitrogen on yield components and yield of maize (Zea mays L.) in Kachabirra district, Kembata Tambaro zone, southern Ethiopia. International Journal of Research in Agricultural Sciences, 7(3), 2348-3997. |
| [3] | Abera, T., Lemma, A., Hundesa, C., Husen, A., & Firomsa, T. (2021). Response of yield components and yield of bread wheat (Triticum aestivum L.) to blended NPS and N fertilizers levels at Liban Chukala District, East Shewa Zone, Oromia, Ethiopia. International journal of research and innovation in earth science, 8(1), 2394-1375. |
| [4] | Abera, T., Tola, B., Tufa, T., Adugna, A., & Midega, T. (2021). Effects of belended (NPSB) and urea fertilizer rate on yield and yield components of wheat in ultisols of liban jawi district, Oromia, Ethiopia. American-Eurasian Journal of Agricultural and Environmental Sciences, 21(2), 87-97. |
| [5] | Abera, Y., & Kassa, S. (2017). Status of soil micronutrients in Ethiopian soils: a review. Journal of environment and earth science, 7(4), 85-90. |
| [6] | Aboye, A. D., & Teto, A. M. (2022). Pilot Review Study on Current Research Status and Economic Value Limitations of Bread Wheat (Triticum aestivum L.) Production in Ethiopia. Economics, 11(4), 137-166. |
| [7] | Alamzeb, M., Anwar, S., Iqbal, A., Parmar, B., & Iqbal, M. (2017). Organic sources, nitrogen and tillage systems improve wheat productivity and profitability under semiarid climates. Journal of Pharmacognosy and Phytochemistry, 1, 73-78. |
| [8] | Alemu Rorisa, S. (2017). EFFECT OF BLENDED NPS AND N FERTILIZER RATES ON YIELD COMPONENTS, YIELD AND GRAIN PROTEIN CONTENT OF BREAD WHEAT (Triticum aestivum L.) IN BORE DISTRICT, GUJI ZONE, SOUTHERN ETHIOPIA (Doctoral dissertation, Haramaya university)., Ethiopia). |
| [9] | Ali, A., Ahmad, A., Syed, W. H., Khaliq, T., Asif, M., Aziz, M., & Mubeen, M. (2011). Effects of nitrogen on growth and yield components of wheat.(Report). Science International (Lahore), 24, 331-2. |
| [10] | Anwar, S., Israeel, B. I., Khan, S., Faraz, M., Ali, N., Hussain, S., & Anjum, M. M. (2021). 07. Nitrogen and phosphorus fertilization of improved varieties for enhancing yield and yield components of wheat. Pure and Applied Biology (PAB), 5(4), 727-737. |
| [11] | Arega, G., & Setu, B. (2014). Prevalence, Incidence and Severity of Wheat Rust, an Response of Wheat Cultivars to Rust Infection. International Journal of Agronomy and Plant Production, 5(1), 13-19. |
| [12] | Beketa, H. J., Kefale, D., & Yoseph, T. (2020). Effect of blended fertilizer types and rates on growth, yield and yield components of bread wheat (Triticum aestivum L.) in Wondo District, Southern Ethiopia. International Journal of Agriculture Innovations and Research, 8(4), 326-342. |
| [13] | Brady, N. C., Weil, R. R. and Weil, R. R., 2008. The nature and properties of soils (Vol. 13, pp. 662-710). Upper Saddle River, NJ: Prentice Hall. |
| [14] | Chaparro, J. M., Sheflin, A. M., Manter, D. K., & Vivanco, J. M. (2012). Manipulating the soil microbiome to increase soil health and plant fertility. Biology and Fertility of Soils, 48, 489-499. |
| [15] | Das, D. K., & Mandal, M. (2015). Advanced technology of fertilizer uses for crop production. Fertilizer Technology I Synthesıs. Sinha, S., Pant, KK, Bajpai, S. (Eds.). Studium Press, LLC, USA, 101-150. |
| [16] | Dewis, J. and Freitas, F., 1970. Physical and chemical methods of soil and water analysis. |
| [17] | Donis, A., Getahun, D., Geremu, T., Girma, D., Feyisa, A., Dejene, L., & Tolosa, M. (2021). Determination of NPS Fertilizer Rate Based on Calibrated Phosphorus for Yield of Bread Wheat in Wachale District, North Shewa Zone, Oromia, Ethiopia. American Journal of Plant Biology, 6(3), 73-77. |
| [18] | EthioSIS, 2014. Soil fertility classification system. |
| [19] | Goda, D. D. (2022). Influence of nitrogen fertilizer levels on growth and development of bread wheat (Triticum aestivum L.) varieties at Kulumsa, South-Eastern Ethiopia. American Journal of Life Sciences, 10(2), 21-27. |
| [20] | Grant, C. D., 2003. Book Review: The Nature and Properties of Soils, NC Brady, RR Weil, Prentice Hall, Upper Saddle River, NJ, 960 pp., ISBN 0-13-016763-0. Agriculture, Ecosystems and Environment, 95(1), pp. 393-394. |
| [21] | Guarin, J. R., Martre, P., Ewert, F., Webber, H., Dueri, S., Calderini, D., Reynolds, M., Molero, G., Miralles, D., Garcia, G. and Slafer, G., 2022. Evidence for increasing global wheat yield potential. Environmental Research Letters, 17(12), p. 124045. |
| [22] | Guo, Z., Zhao, Y., Röder, M. S., Reif, J. C., Ganal, M. W., Chen, D., & Schnurbusch, T. (2018). Manipulation and prediction of spike morphology traits for the improvement of grain yield in wheat. Scientific reports, 8(1), 1-10. |
| [23] | Haileselassie, B., Habte, D., Haileselassie, M., & Gebremeskel, G. (2014). Effects of mineral nitrogen and phosphorus fertilizers on yield and nutrient utilization of bread wheat (Tritcum aestivum) on the sandy soils of Hawzen District, Northern Ethiopia. Agriculture, Forestry and Fisheries, 3(3), 189-198.-198. |
| [24] | Harfe, M. (2017). Response of bread wheat (Triticum aestivum L.) varieties to N and P fertilizer rates in Ofla district, Southern Tigray, Ethiopia. African Journal of Agricultural Research, 12(19), 1646-1660. |
| [25] | Havlin, J., Balster, N., Chapman, S., Ferris, D., Thompson, T. and Smith, T., 2010. Trends in soil science education and employment. Soil Science Society of America Journal, 74(5), pp. 1429-1432. |
| [26] | Hazelton, P. and Murphy, B., 2025. Interpreting soil test results: What do all the numbers mean?. CSIRO publishing. |
| [27] | Horneck, D. A., et al., 2011. Soil nutrient analysis methods. |
| [28] | Horneck, D. A., Sullivan, D. M., Owen, J. S. and Hart, J. M., 2011. Soil test interpretation guide. |
| [29] | Hussain, S., Farooq, M., Wahid, M. A., & Wahid, A., 2013 (2019). Grain quality and yield response of bread wheat (Triticum aestivum L.) Varieties to different rates of blended fertilizer at Kulumsa, South-eastern Ethiopia, 4(August), pp. 120-133. |
| [30] | Islam, J. N. (2002). An introduction to mathematical cosmology. Cambridge University Press. |
| [31] | Itelima, J. U., Bang, W. J., Onyimba, I. A., Sila, M. D. and Egbere, O. J., 2018. Bio-fertilizers as key player in enhancing soil fertility and crop productivity: A review. |
| [32] | Khan MA, Hussain I, Baloch MS. 1999. Wheat yield potential current status and future strategies. Pak J Biol Sci.; 3(1): 82-6. |
| [33] | KINACI, G. (2000). Effect of zinc microelement on quality of some wheat cultivars grown in Central Anatolia. Turkish Journal of Agriculture and Forestry, 24(5), 601-606. |
| [34] | Landon, J. R., 1991. Booker tropical soil manual; a handbook for soil survey and agricultural land evaluation in the tropics and subtropics. |
| [35] | Landon, J. R., 2014. Booker tropical soil manual: a handbook for soil survey and agricultural land evaluation in the tropics and subtropics. Routledge. |
| [36] | Maqsood, M. U. H. A. M. M. A. D., Ali, A. S. I. F., Aslam, Z., Saeed, M., & Ahmad, S. (2002). Effect of irrigation and nitrogen levels on grain yield and quality of wheat (Triticum aestivum L). Int. J. Agri. Biol, 4(1), 164-165. |
| [37] | Melesse H., 2017. Response of bread wheat (Triticum aestivum L.) varieties to N and P fertilizer rates in Ofla district, Southern Tigray, Ethiopia. African Journal of Agricultural Research 12(19): 1646-1660. |
| [38] | Mulugeta, T., 2018. EFFECTS OF LAND USE TYPES ON SELECTED SOIL PHYSICOCHEMICAL PROPERTIES: THE CASE OF KUYU DISTRICT, CENTRAL HIGHLAND OF ETHIOPIA (Doctoral dissertation). |
| [39] | Olsen, S. R., 1954. Estimation of available phosphorus in soils by extraction with sodium bicarbonate (No. 939). US Department of Agriculture. |
| [40] | Prystupa, P., Slafer, G. A. and Savin, R., 2003. Leaf appearance, tillering and their coordination in response to NxP fertilization in barley. Plant and Soil, 255, pp. 587-594. |
| [41] | Rut-Duga, D., Diriba-Shiferaw, G., & Worku, W. (2019). Effects of blended fertilizer rates on bread wheat (Triticum aestivum L.) varieties on growth and yield attributes. Journal of Biology, Agriculture and Healthcare, 9(15), 1-12. |
| [42] | Senbeta, A. F., & Worku, W. (2023). Ethiopia’s wheat production pathways to self-sufficiency through land area expansion, irrigation advance, and yield gap closure. Heliyon, 9(10). Bio-resource and Stress Management, 14(1), 19-32. |
| [43] | Sigaye, M. H., Mekuria, R. and Kebede, K., 2022. Effect of NPS-B Blended and Nitrogen Fertilizers Application on Bread Wheat Yield and Economic Profitability on Nitisol of Southern, Ethiopia. |
| [44] | Singh nee’ Nigam, P., Gupta, N. and Anthwal, A., 2009. Pre-treatment of agro-industrial residues. Biotechnology for agro-industrial residues utilisation: Utilisation of agro-residues, pp. 13-33. |
| [45] | Spink, J. H., Semere, T., Sparkes, D. L., Whaley, J. M., Foulkes, M. J., Clare, R. W., & Scott, R. K. (2000). Effect of sowing date on the optimum plant density of winter wheat. Annals of applied biology, 137(2), 179-188. |
| [46] | Stewart, W. M., Dibb, D. W., Johnston, A. E. and Smyth, T. J., 2005. The contribution of commercial fertilizer nutrients to food production. Agronomy journal, 97(1), pp. 1-6. |
| [47] | Tadesse, W., Bishaw, Z., & Assefa, S. (2019). Wheat production and breeding in Sub-Saharan Africa: Challenges and opportunities in the face of climate change. International Journal of Climate Change Strategies and Management, 11(5), 696-715. |
| [48] | Tagesse, A., B. Ketema and T. Tamado, 2018. Effect of Blended NPS Fertilizer Supplemented with Nitrogen on Yield Components and Yield of Bread Wheat (Triticum aestivum L.). Journal of Natural Sciences Research, 18(11): 90-96. |
| [49] | Tekalign, M., et al., 1991. Ethiopian soil analysis procedures. |
| [50] | Usman Kedir1, Tamado Tana2, W. W., 2020. Effects of Blended (NPSB) Fertilizer Rates on Yield Components, Yield and Grain Quality of Bread Wheat (Triticum Aestivum L.) Varieties at Kulumsa, South-Eastern Ethiopia, 8(9), pp. 14-27. |
| [51] | Walkley, A. and Black, I. A., 1934. An examination of the Degtjareff method for determining soil organic matter, and a proposed modification of the chromic acid titration method. Soil science, 37(1), pp. 29-38. |
APA Style
Jida, D. M. (2026). Effect of NPS and Urea Fertilizer Rates on Phenology, Growth and Yield Components of Bread Wheat (Triticum Aestivum L.) in West Guji Southern Oromia. Science Journal of Chemistry, 14(4), 130-141. https://doi.org/10.11648/j.sjc.20261404.12
ACS Style
Jida, D. M. Effect of NPS and Urea Fertilizer Rates on Phenology, Growth and Yield Components of Bread Wheat (Triticum Aestivum L.) in West Guji Southern Oromia. Sci. J. Chem. 2026, 14(4), 130-141. doi: 10.11648/j.sjc.20261404.12
AMA Style
Jida DM. Effect of NPS and Urea Fertilizer Rates on Phenology, Growth and Yield Components of Bread Wheat (Triticum Aestivum L.) in West Guji Southern Oromia. Sci J Chem. 2026;14(4):130-141. doi: 10.11648/j.sjc.20261404.12
@article{10.11648/j.sjc.20261404.12,
  author = {Deme Megersa Jida},
  title = {Effect of NPS and Urea Fertilizer Rates on Phenology, Growth and Yield Components of Bread Wheat
(Triticum Aestivum L.) in West Guji Southern Oromia},
  journal = {Science Journal of Chemistry},
  volume = {14},
  number = {4},
  pages = {130-141},
  doi = {10.11648/j.sjc.20261404.12},
  url = {https://doi.org/10.11648/j.sjc.20261404.12},
  eprint = {https://article.sciencepublishinggroup.com/pdf/10.11648.j.sjc.20261404.12},
  abstract = {Bread wheat (Triticum aestivum L.) is one of the major food crops cultivated in West Guji and plays a significant role in ensuring food security in Ethiopia. However, low soil fertility and inadequate fertilizer application are among the major constraints limiting wheat productivity in the study area. The study took place in the West Guji southern Oromia, during the main cropping season in 2023. The study was aimed to determine the combined application of NPS and urea (N) fertilizer rates for bread wheat (Triticum aestivum L.) production. The treatments were (0 NPS) negative control, 60 kg NPS, 120 kg NPS, and 180 kg NPS, and (0 N) negative control, 140 kg N, 280 kg N, and positive control (100/100 kg ha⁻1 NPS/N). The treatments were arranged in a randomized complete block design and replicated three times. The results of the analysis of variance for agronomic characters indicated that the effects of fertilizer application rates were significant for the date of 50% heading, the date of 90% physiological maturity, plant height, the number of total tillers per plant, spike length per plant, effective tiller per plant, spikelet per spike, the number of grains per spike, thousand seed weight, and harvest index. The maximum duration of 50% days to heading (83.67 days) and day to 90% physiological maturity (136 days) was obtained from unfertilized plants, whereas the minimum duration of 50% day to heading (70.33 days) and day to 90% physiological maturity (120 days) was obtained from 180 kg NPS ha⁻1 + 280 kg N ha⁻1 fertilizer rates, respectively. The maximum plant height (92.5 cm) was also recorded under the highest fertilizer treatment, indicating a strong correlation between nutrient application and plant growth. These findings suggest that balanced fertilizer rates can significantly enhance both yield components and overall plant development. 21 cm), effective tiller per plant (5.21), number of total tillers per plant (5.25), spike length (9.21 cm), and 180 kg NPS ha⁻1 + 280 kg N ha⁻1 fertilizer rates, respectively. The maximum spikelet per spike (19) and number of grains per spike (74.67) were obtained from 120 kg NPS ha⁻1 + 140 kg N ha⁻1 fertilizer rates, respectively. The maximum thousand grains weight (38.00 gm) and harvest index (44.33%) were obtained from 180 kg NPS ha⁻1 + 140 kg N ha⁻1 fertilizer rates, respectively. Therefore, 180 kg/280 kg and 180 kg/140 kg ha⁻1 NPS/urea (N) are better, but 120/140 kg is best for gain yield, and the farming community can be used in the study area. This suggests that optimizing fertilizer application can significantly enhance bread wheat yield and yield components. Future research should focus on refining these rates further to maximize efficiency and sustainability in agricultural practices.},
 year = {2026}
}
TY  - JOUR
T1  - Effect of NPS and Urea Fertilizer Rates on Phenology, Growth and Yield Components of Bread Wheat
(Triticum Aestivum L.) in West Guji Southern Oromia
AU  - Deme Megersa Jida
Y1  - 2026/09/08
PY  - 2026
N1  - https://doi.org/10.11648/j.sjc.20261404.12
DO  - 10.11648/j.sjc.20261404.12
T2  - Science Journal of Chemistry
JF  - Science Journal of Chemistry
JO  - Science Journal of Chemistry
SP  - 130
EP  - 141
PB  - Science Publishing Group
SN  - 2330-099X
UR  - https://doi.org/10.11648/j.sjc.20261404.12
AB  - Bread wheat (Triticum aestivum L.) is one of the major food crops cultivated in West Guji and plays a significant role in ensuring food security in Ethiopia. However, low soil fertility and inadequate fertilizer application are among the major constraints limiting wheat productivity in the study area. The study took place in the West Guji southern Oromia, during the main cropping season in 2023. The study was aimed to determine the combined application of NPS and urea (N) fertilizer rates for bread wheat (Triticum aestivum L.) production. The treatments were (0 NPS) negative control, 60 kg NPS, 120 kg NPS, and 180 kg NPS, and (0 N) negative control, 140 kg N, 280 kg N, and positive control (100/100 kg ha⁻1 NPS/N). The treatments were arranged in a randomized complete block design and replicated three times. The results of the analysis of variance for agronomic characters indicated that the effects of fertilizer application rates were significant for the date of 50% heading, the date of 90% physiological maturity, plant height, the number of total tillers per plant, spike length per plant, effective tiller per plant, spikelet per spike, the number of grains per spike, thousand seed weight, and harvest index. The maximum duration of 50% days to heading (83.67 days) and day to 90% physiological maturity (136 days) was obtained from unfertilized plants, whereas the minimum duration of 50% day to heading (70.33 days) and day to 90% physiological maturity (120 days) was obtained from 180 kg NPS ha⁻1 + 280 kg N ha⁻1 fertilizer rates, respectively. The maximum plant height (92.5 cm) was also recorded under the highest fertilizer treatment, indicating a strong correlation between nutrient application and plant growth. These findings suggest that balanced fertilizer rates can significantly enhance both yield components and overall plant development. 21 cm), effective tiller per plant (5.21), number of total tillers per plant (5.25), spike length (9.21 cm), and 180 kg NPS ha⁻1 + 280 kg N ha⁻1 fertilizer rates, respectively. The maximum spikelet per spike (19) and number of grains per spike (74.67) were obtained from 120 kg NPS ha⁻1 + 140 kg N ha⁻1 fertilizer rates, respectively. The maximum thousand grains weight (38.00 gm) and harvest index (44.33%) were obtained from 180 kg NPS ha⁻1 + 140 kg N ha⁻1 fertilizer rates, respectively. Therefore, 180 kg/280 kg and 180 kg/140 kg ha⁻1 NPS/urea (N) are better, but 120/140 kg is best for gain yield, and the farming community can be used in the study area. This suggests that optimizing fertilizer application can significantly enhance bread wheat yield and yield components. Future research should focus on refining these rates further to maximize efficiency and sustainability in agricultural practices.
VL  - 14
IS  - 4
ER  -
Oromia Institute of Agricultural Research, Yabelo Pastoral and Dry Land Agricultural Research Center, Yabelo, Ethiopia

Information



 Share This Article
 Twitter
 Linked In
 Facebook
 Copy
Copy Download